
Impact of non-pharmaceutical interventions (NPIs)
to reduce COVID-19 mortality and healthcare demand
“Here we present the results of epidemiological modelling which has informed policy-making in the UK and other countries in recent weeks.” — March 16
Summary
The global impact of COVID-19 has been profound, and the public health threat it represents is the most serious seen in a respiratory virus since the 1918 H1N1 influenza pandemic. Here we present the results of epidemiological modelling which has informed policy-making in the UK and other countries in recent weeks. In the absence of a COVID-19 vaccine, we assess the potential role of a number of public health measures – so-called non-pharmaceutical interventions (NPIs) – aimed at reducing contact rates in the population and thereby reducing transmission of the virus. In the results presented here, we apply a previously published micro-simulation model to two countries: the UK (Great Britain specifically) and the US. We conclude that the effectiveness of any one intervention in isolation is likely to be limited, requiring multiple interventions to be combined to have a substantial impact on transmission.
Two fundamental strategies are possible: (a) mitigation, which focuses on slowing but not necessarily stopping epidemic spread – reducing peak healthcare demand while protecting those most at risk of severe disease from infection, and (b) suppression, which aims to reverse epidemic growth, reducing case numbers to low levels and maintaining that situation indefinitely. Each policy has major challenges. We find that that optimal mitigation policies (combining home isolation of suspect cases, home quarantine of those living in the same household as suspect cases, and social distancing of the elderly and others at most risk of severe disease) might reduce peak healthcare demand by 2/3 and deaths by half. However, the resulting mitigated epidemic would still likely result in hundreds of thousands of deaths and health systems (most notably intensive care units) being overwhelmed many times over. For countries able to achieve it, this leaves suppression as the preferred policy option.
We show that in the UK and US context, suppression will minimally require a combination of social distancing of the entire population, home isolation of cases and household quarantine of their family members. This may need to be supplemented by school and university closures, though it should be recognized that such closures may have negative impacts on health systems due to increased absenteeism. The major challenge of suppression is that this type of intensive intervention package – or something equivalently effective at reducing transmission – will need to be maintained until a vaccine becomes available (potentially 18 months or more) – given that we predict that transmission will quickly rebound if interventions are relaxed. We show that intermittent social distancing – triggered by trends in disease surveillance – may allow interventions to be relaxed temporarily in relative short time windows, but measures will need to be reintroduced if or when case numbers rebound. Last, while experience in China and now South Korea show that suppression is possible in the short term, it remains to be seen whether it is possible long-term, and whether the social and economic costs of the interventions adopted thus far can be reduced.
Table 1: Current estimates of the severity of cases. The IFR estimates from Verity et al.12 have been adjusted to account for a non-uniform attack rategiving an overall IFR of 0.9% (95% credible interval0.4%-1.4%). Hospitalisation estimates from Verity et al.12 were also adjusted in this way and scaled to match expected rates in the oldest age-group (80+ years)in a GB/US context. These estimates will be updated as more data accrue.
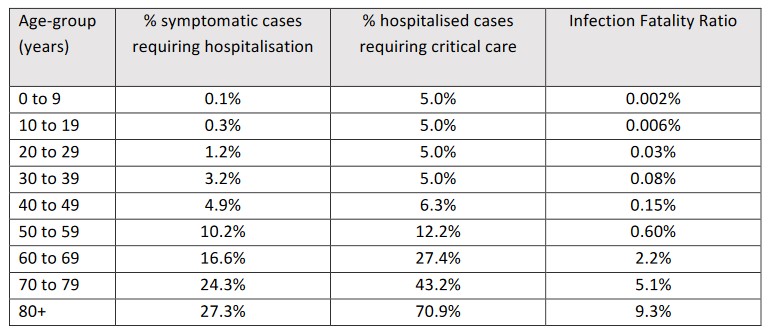
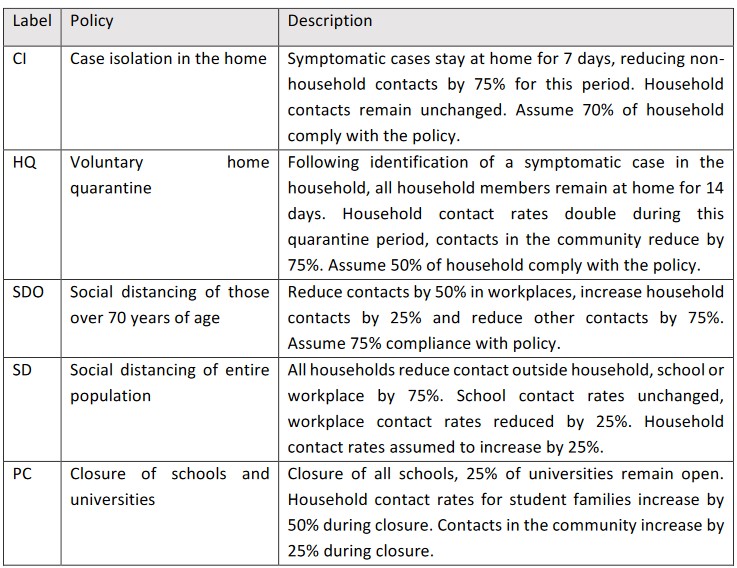
Table 2: Summary of NPI interventions considered.
Unmitigated epidemic scenarios for GB and the US. Projected deaths per day per 100,000 population in GB and US. — This is for an uncontrolled epidemic.
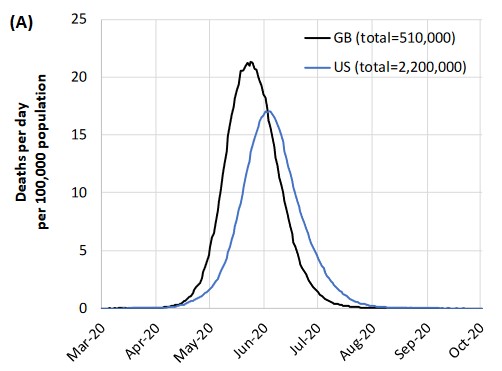
To minimize deaths, we need to stretch the peak over a longer time frame. Respiration difficulties requiring hospitalization is the danger with this virus. We do not have enough life-saving equipment or beds if we let this virus crest naturally. The obvious benefit of an unmitigated epidemic is it’s over in a short time and you are either immune or otherwise. However, “We find that optimal mitigation policies might reduce peak healthcare demand by 2/3 and deaths by half.”
From here onward, we are looking at Critical Care Beds occupied
per 100k of population, not deaths.
Critical care need occurs about 3 weeks after infection.
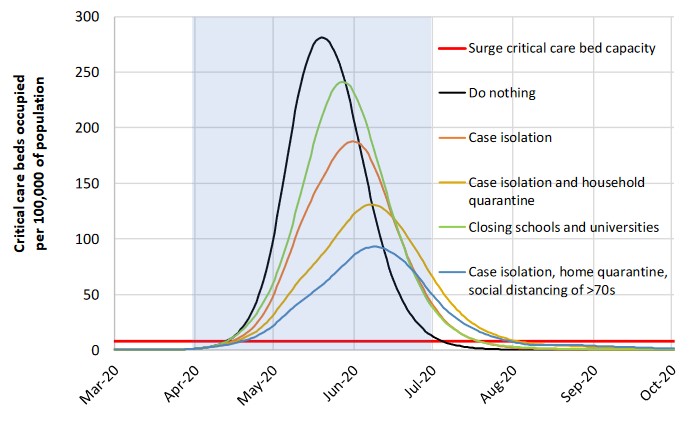
“For an uncontrolled epidemic, we predict critical care bed capacity would be exceeded as early as the second week in April, with an eventual peak in ICU or critical care bed demand that is over 30 times greater than the maximum supply in both countries (Figure 2).”
Figure 2: Mitigation strategy scenarios for GB showing critical care (ICU) bed requirements. The black line shows the unmitigated epidemic. The green line shows a mitigation strategy incorporating closure of schools and universities; orange line shows case isolation; yellow line shows case isolation and household quarantine; and the blue line shows case isolation, home quarantine and social distancing of those aged over 70. The blue shading shows the 3-month period in which these interventions are assumed to remain in place.
When restrictions are relaxed, and people are able to mingle again, infections will rise in the absence of a vaccine. “To avoid a rebound in transmission, these policies will need to be maintained until large stocks of vaccine are available to immunize the population–which could be 18 months or more.“
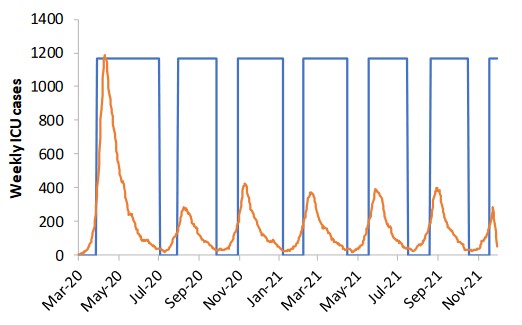
Until a vaccine becomes available, we may see two-month rolling restrictions every month or so to control the virus spread. Tightening restrictions will be driven by reported Weekly ICU cases with an “on” trigger and an “off” trigger, like a thermostat. With an initial restriction period of 3-5 months, we can expect rolling restrictions to be in force for two-thirds of the time. That would look something like the figure below. The square blue boxes are the restriction periods. Note: divisions on the bottom scale are two months.
Figure 4: Illustration of adaptive triggering of suppression strategies in GB, a policy of all four interventions considered, an “on” trigger of 100 ICU cases in a week and an “off” trigger of 50 ICU cases. The policy is in force approximate 2/3 of the time. Only social distancing and school/university closure are triggered; other policies remain in force throughout. Weekly ICU incidence is shown in orange, policy triggering in blue.
Hold on tight. We’ve never done this before.
